DOCUMENTATION · TRANSFORMER IN NUMPY
See the calculation.
Understand the model.
From the first token to the gradient: explore the network, follow the values and open the code behind each operation.
CHOOSE WHERE TO START
Explore. Understand. Experiment.
- 01
Explore with one token
Generate a prediction, read the tokens and explore the lab controls.
- 02
Understand each calculation
Connect vectors, attention and rotations to equations and actual values.
- 03
Program with the engine
Use the same Transformer in Python: inference, snapshots, autograd and training.
FOLLOW THE DATA
One model, two paths
- 01
Split the text
BPE turns characters and subwords into IDs.
text → ids - 02
Look up vectors
Each ID selects an embedding matrix row.
X = E[ids] - 03
Connect the context
4 blocks combine causal attention, residuals and SwiGLU.
Q, K, V · RoPE · GQA - 04
Project the output
Normalize and compare output with the vocabulary.
z = RMSNorm(X) · Eᵀ - 05
Compute probabilities
Temperature controls the selection distribution.
p = softmax(z / T) - 06
Choose the token
Sample with p or select the most likely token.
sample(p) / argmax(p)
The selected token joins the context and starts the next prediction.
- 01
Prepare windows
The target is the next token at each position.
x = ids[t:t+n] · y = ids[t+1:t+n+1] - 02
Run forward
The model produces logits for all positions.
logits: B × n × V - 03
Measure the loss
Cross-entropy penalizes low target probability.
L = −mean(log p[target]) - 04
Backpropagate gradients
Autograd traverses the graph in reverse.
loss.backward() - 05
Update weights
Clipping, learning rate and AdamW adjust parameters.
AdamW.step(lr) - 06
Validate and save
Measure validation loss and save the checkpoint.
evaluate() · model.save()
Updated weights are used on new corpus windows. Training runs through the Python library.
FROM DIAGRAM TO VALUES
Make time for each step.
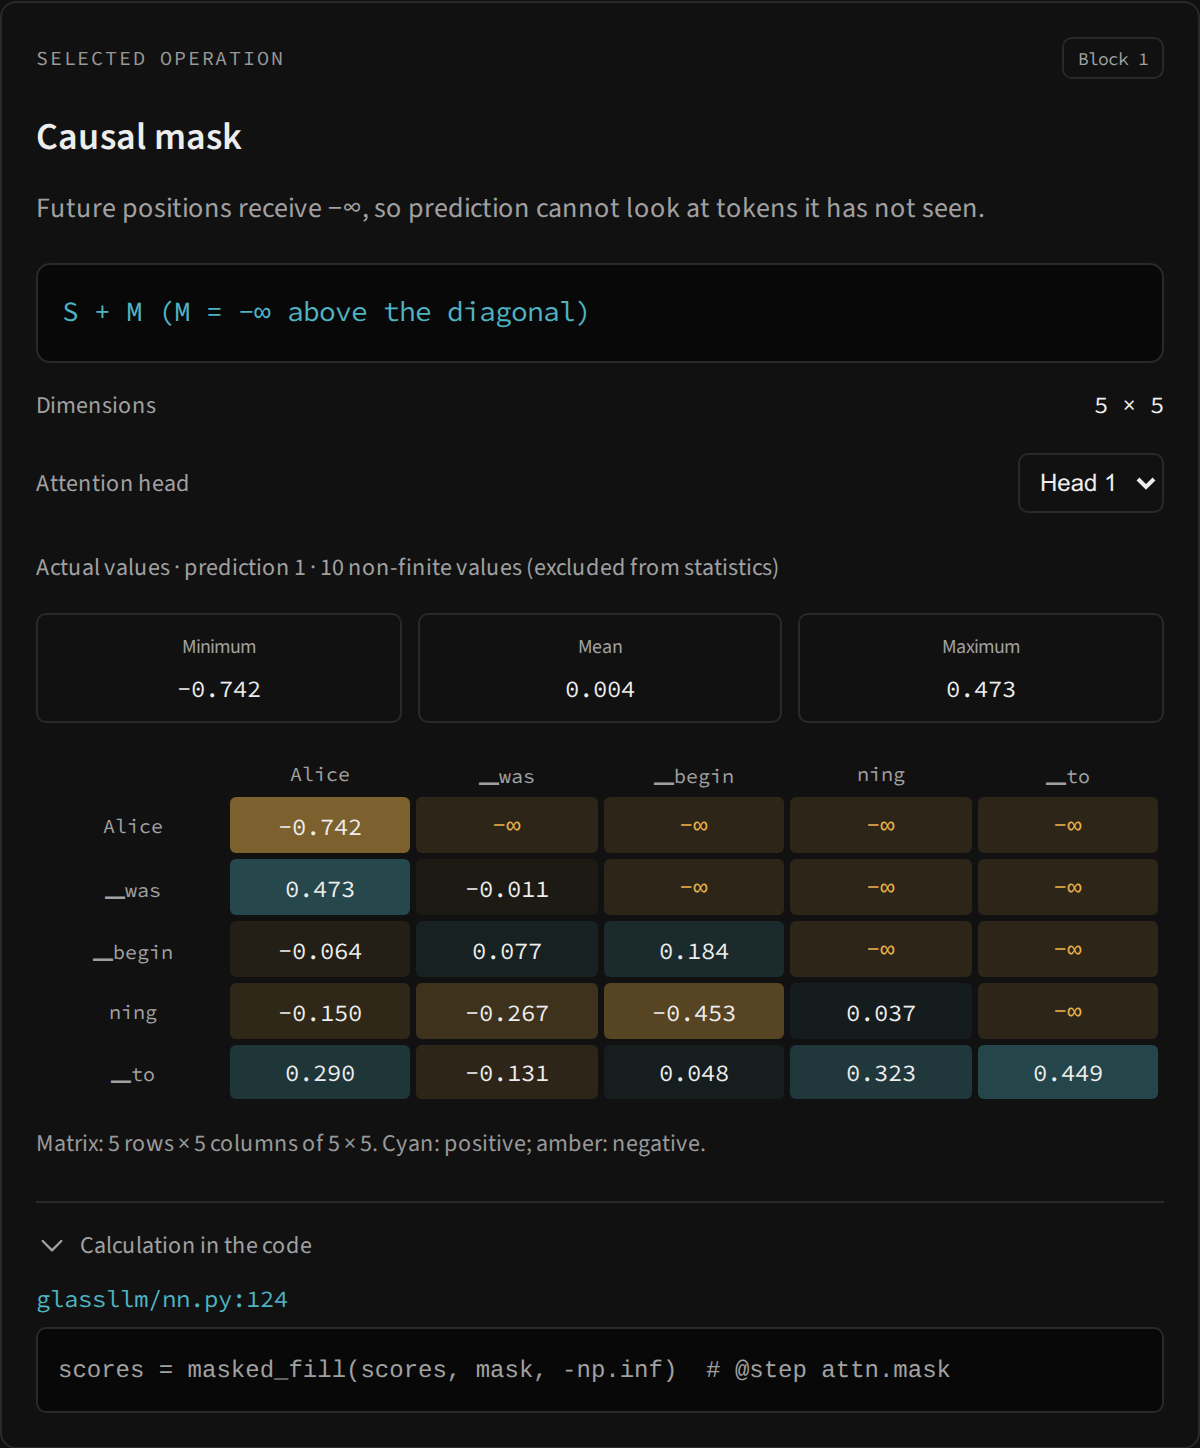
Enable slow motion, pause at Q, K or V and compare the equation with the computed matrix. The inspector shows dimensions, statistics and the Python line that produced the result.
- 01Generate an actual token.
- 02Pause at the calculation you want to study.
- 03Read the explanation, values and source.
ONE LIBRARY, TWO WAYS TO EXPLORE
The site uses the same Python engine.
Lab
Controls, diagram and matrices
TypeScriptWeb Worker
Python in the browser
Pyodide · wheelglassllm
Model, autograd and snapshots
Python · NumPyGeneration runs locally after loading the runtime and weights. The interface receives results and replays the path; training runs through the Python library.
Understand the integrationLOOK IT UP WHEN YOU NEED IT
All documentation
Usage guides, foundations, function reference and papers organized around the path you are studying.
Getting started
3Understand the project and run a first experiment.
Interface guide
8Components, screenshots and lab workflows.
Transformer foundations
9Intuition, equations, dimensions and links to the code.
Library reference
10Contracts, functions, examples and NumPy engine behavior.
Project and references
5Integration, data, validation, glossary and papers.