Read the lab at two scales
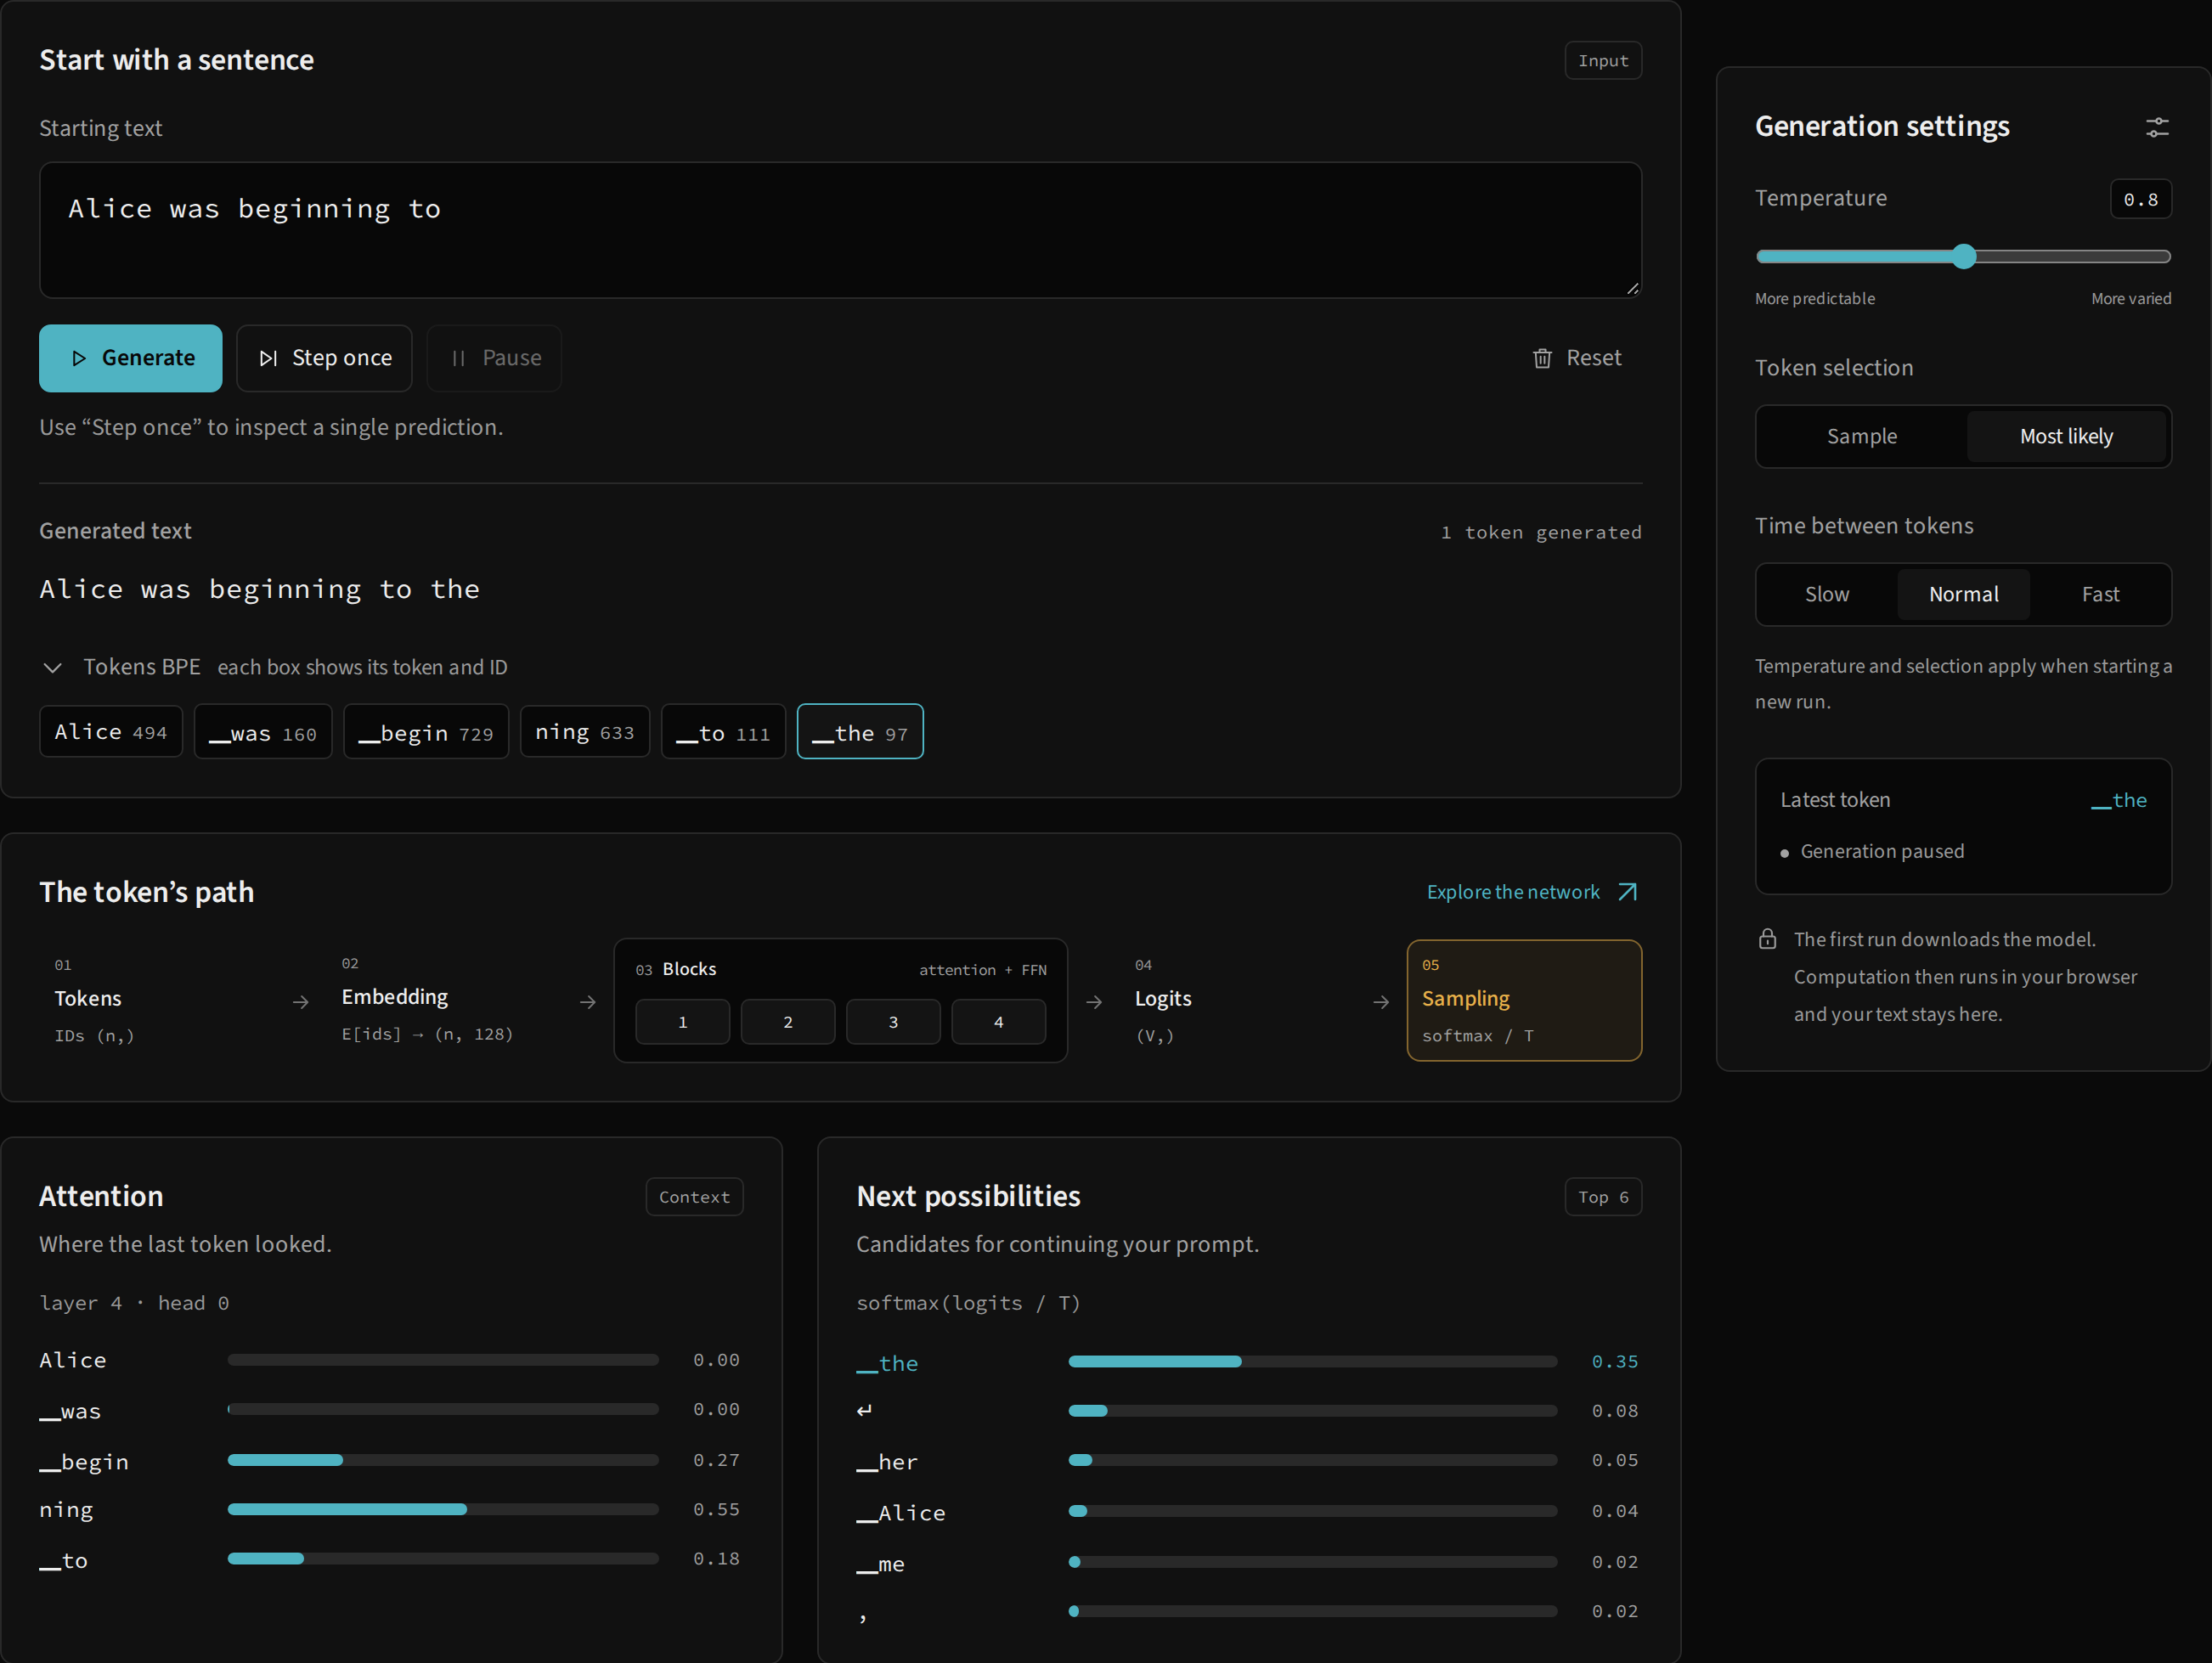
The upper area lets you write prompts and compare predictions quickly. The complete architecture below lets you follow the operations that produced the selected prediction. Both areas use the result of the same model; moving between them does not start a second engine.
The header offers the lab, this documentation, How it works and the PT / EN language switch. Switching language opens another page and loads that language’s assets when you start a prediction. It does not translate the current continuation or preserve an ongoing run.
Components and the questions they answer
| Component | Question answered | What to observe |
|---|---|---|
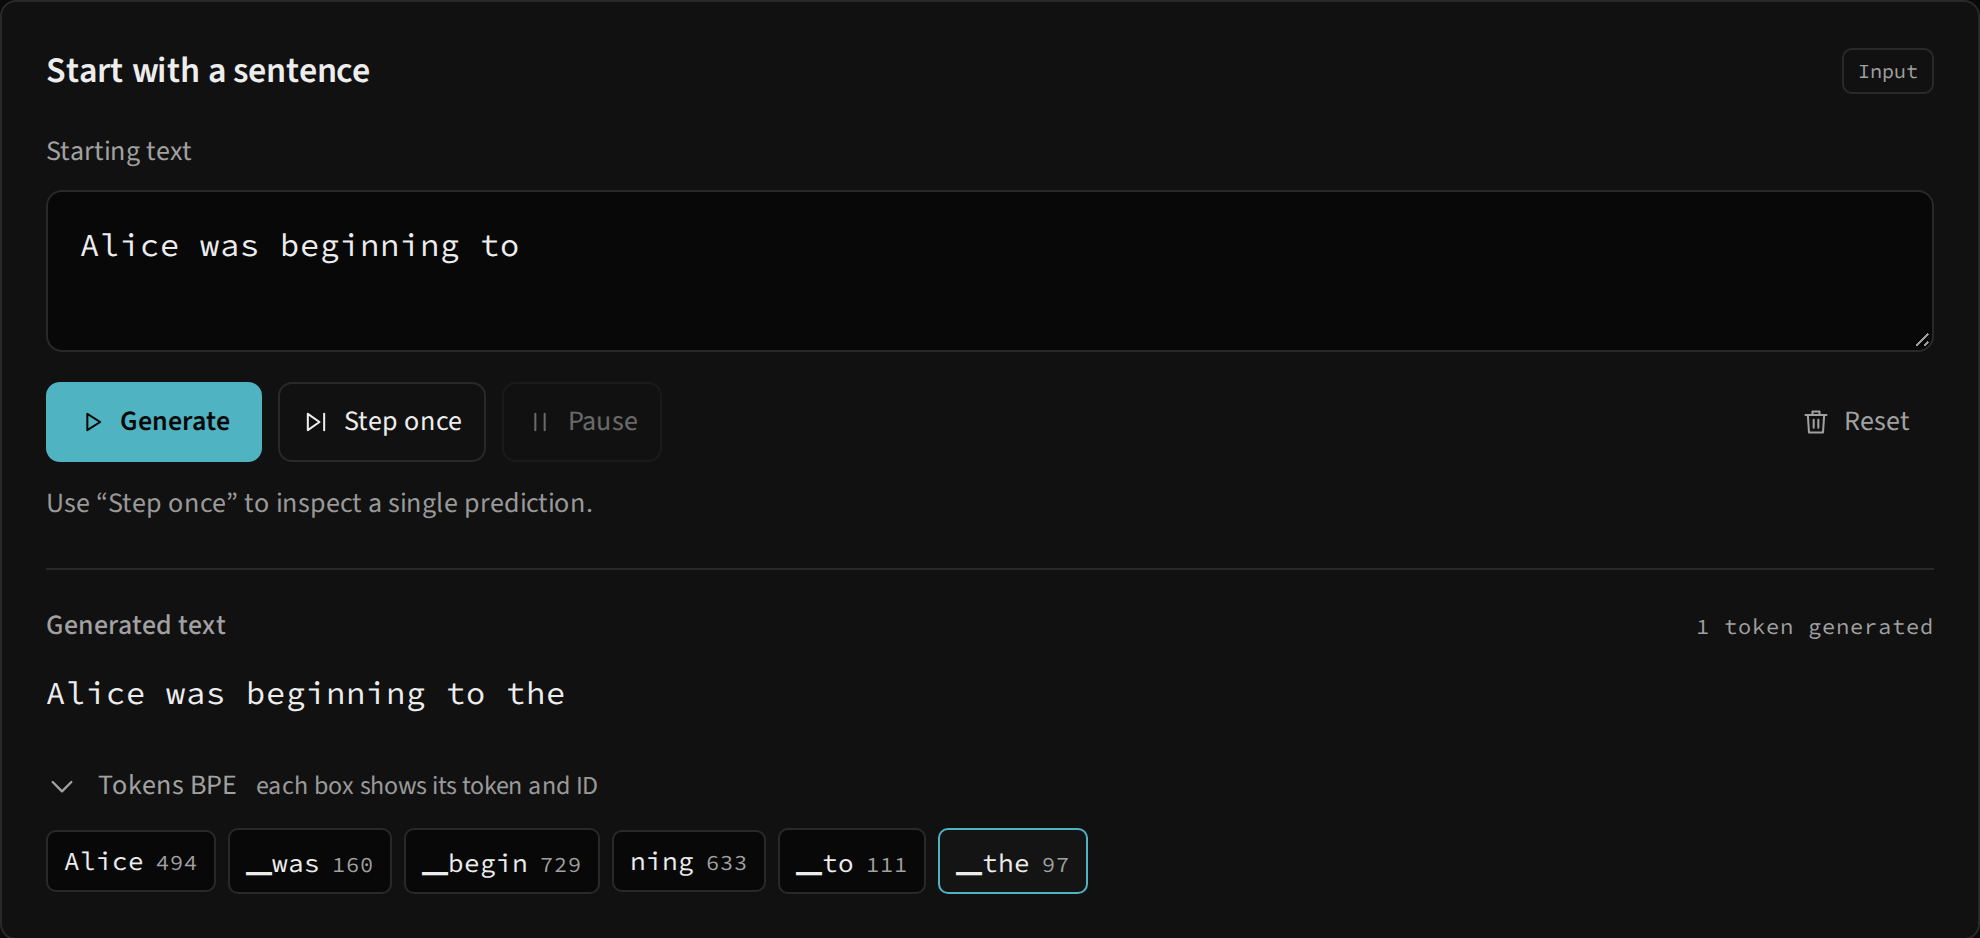
| Starting text | What prefix will I supply? | Prompt of up to 600 characters |
| Generate / Step once / Pause / Reset | How do I advance the run? | Execution state and generated count |
| Generated text | What continuation has been produced? | Prefix followed by decoded IDs |
| BPE tokens | How is the text represented? | Vocabulary piece and its ID |
| The token’s path | Which part of the network are we in? | Embedding, blocks, logits and selection |
| Attention | How did the last query distribute weight over the context? | Fourth block, first head |
| Next possibilities | Which IDs competed to become the next output? | Six highest probabilities |
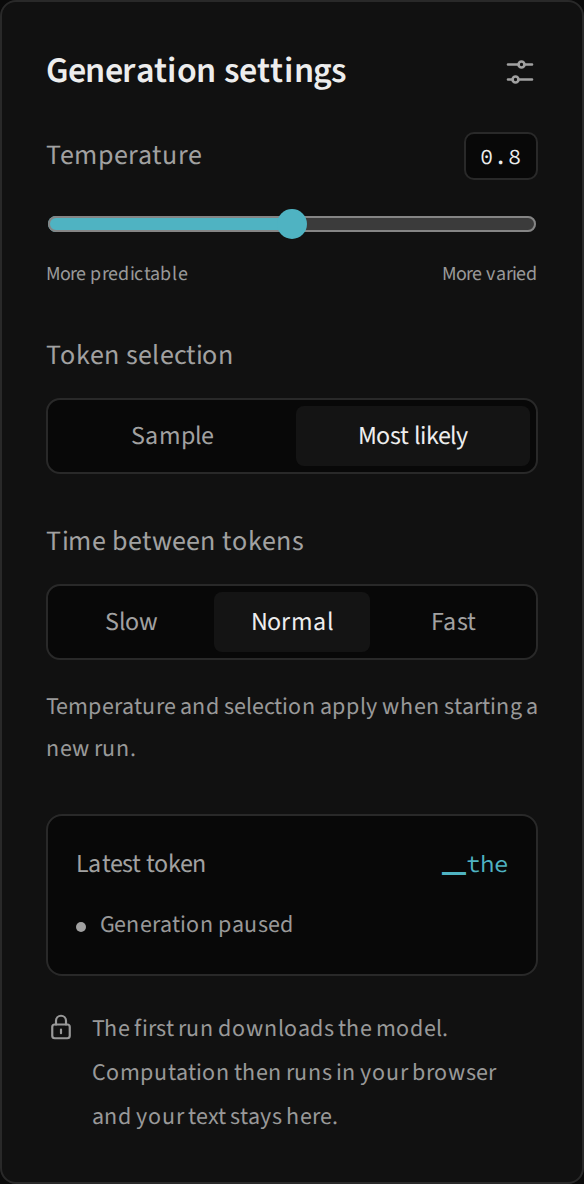
| Generation settings | How are tokens selected and presented? | Temperature, sampling and interval |
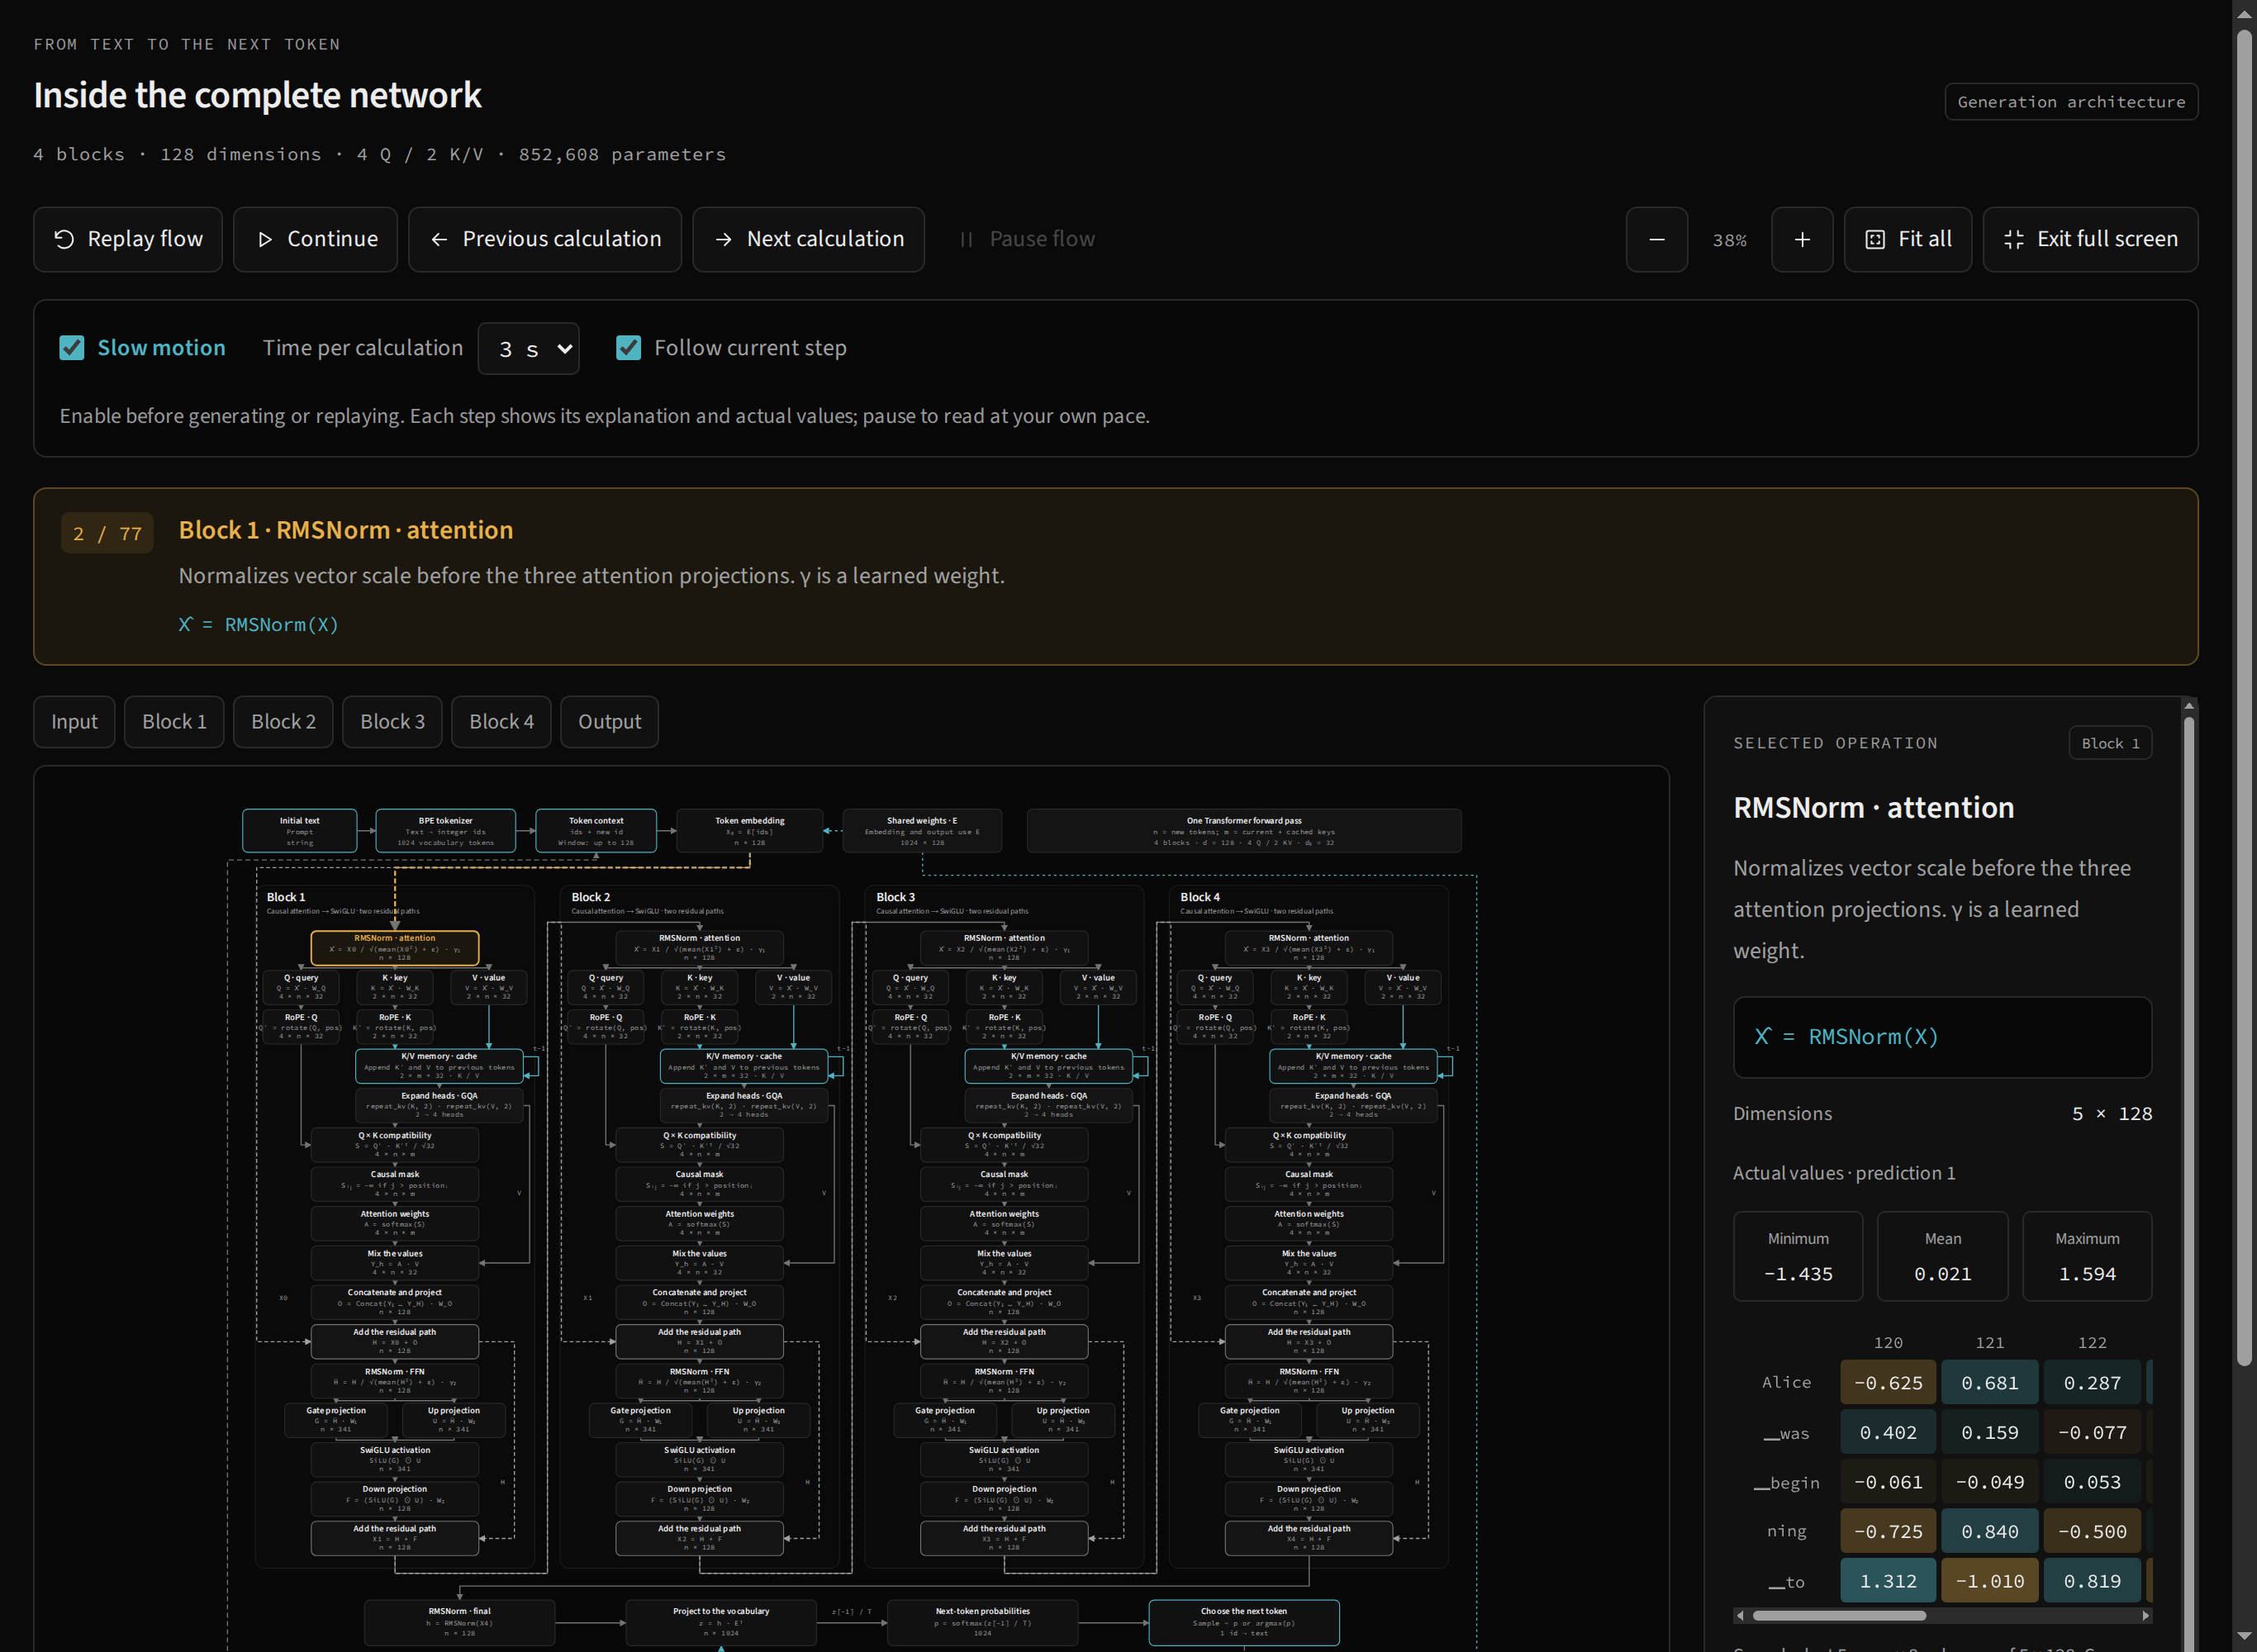
| Complete network | Which calculations and connections make up the prediction? | Operations, residuals, cache and E weights |
| Inspector | Which values and source match the selection? | Equation, shape, statistics and sample |
A reading path in five actions
- Select Most likely to make runs easier to compare.
- Press Step once and read the latest token and its ID.
- Compare the candidate distribution with the attention distribution.
- Open Explore the network and zoom in on a block.
- Select Q, Causal mask or SwiGLU, reading its values and source alongside it.
During continuous generation, clicking an operation pauses generation and playback. This stabilizes the prediction while you read. The generation guide explains resuming and the difference between editing the prompt and starting a new run.
What the screenshots show
This page’s captures use an actual prediction from the default prompt, with temperature 0.8 and greedy selection. lab.png shows the upper area; editor.png shows text, controls and IDs; settings.png shows settings. The 390- and 320-pixel captures show the architecture on mobile, and fullscreen.png shows the enlarged map.
These are pictures of specific states, not a history stored by the interface. PT and EN labels follow the page’s language. To observe other states or values, run the lab and generate your own prediction.
Use a small screen
Panels switch to a vertical reading order. Controls remain available, but the network is larger than the screen: use block navigation, zoom and map scrolling. Matrices may require horizontal scrolling inside the inspector.
You can reach controls with Tab and activate focused operations with Enter or Space. Skip to content lets you bypass the header. To understand the map without following animation, turn off Follow current step and navigate manually. Read architecture for connections and states and troubleshooting for loading and recovery.