Start with the main path
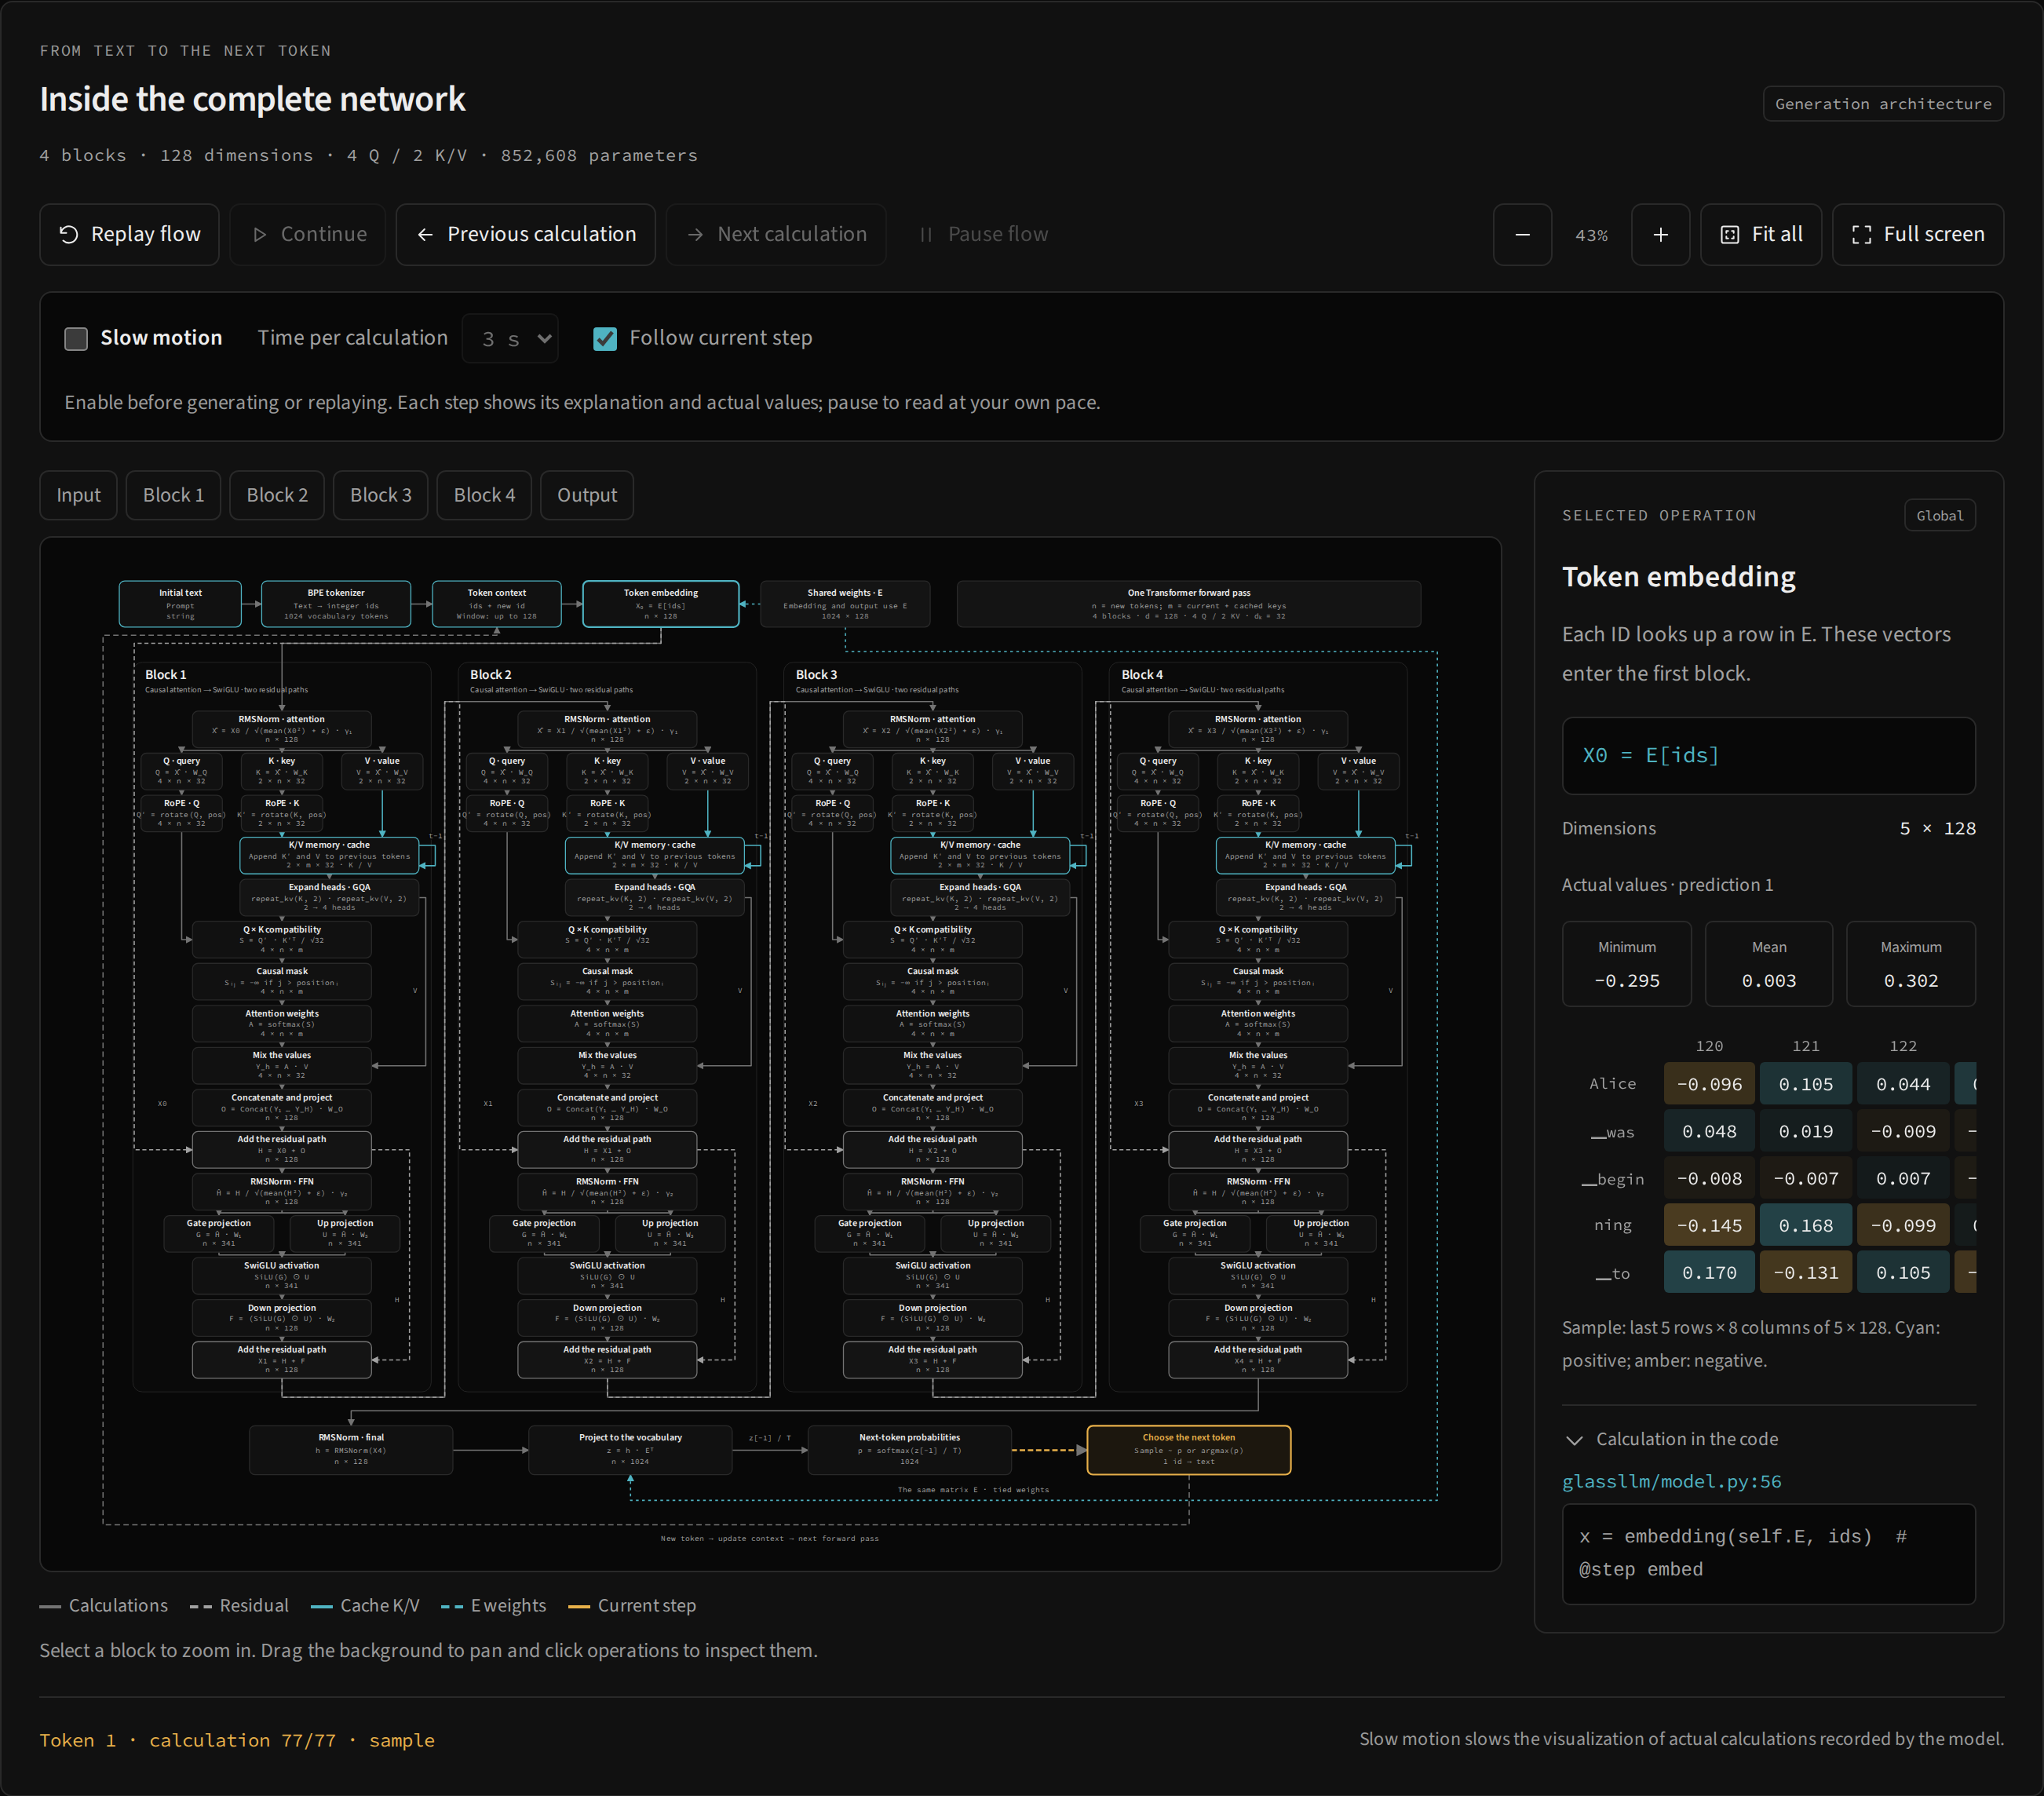
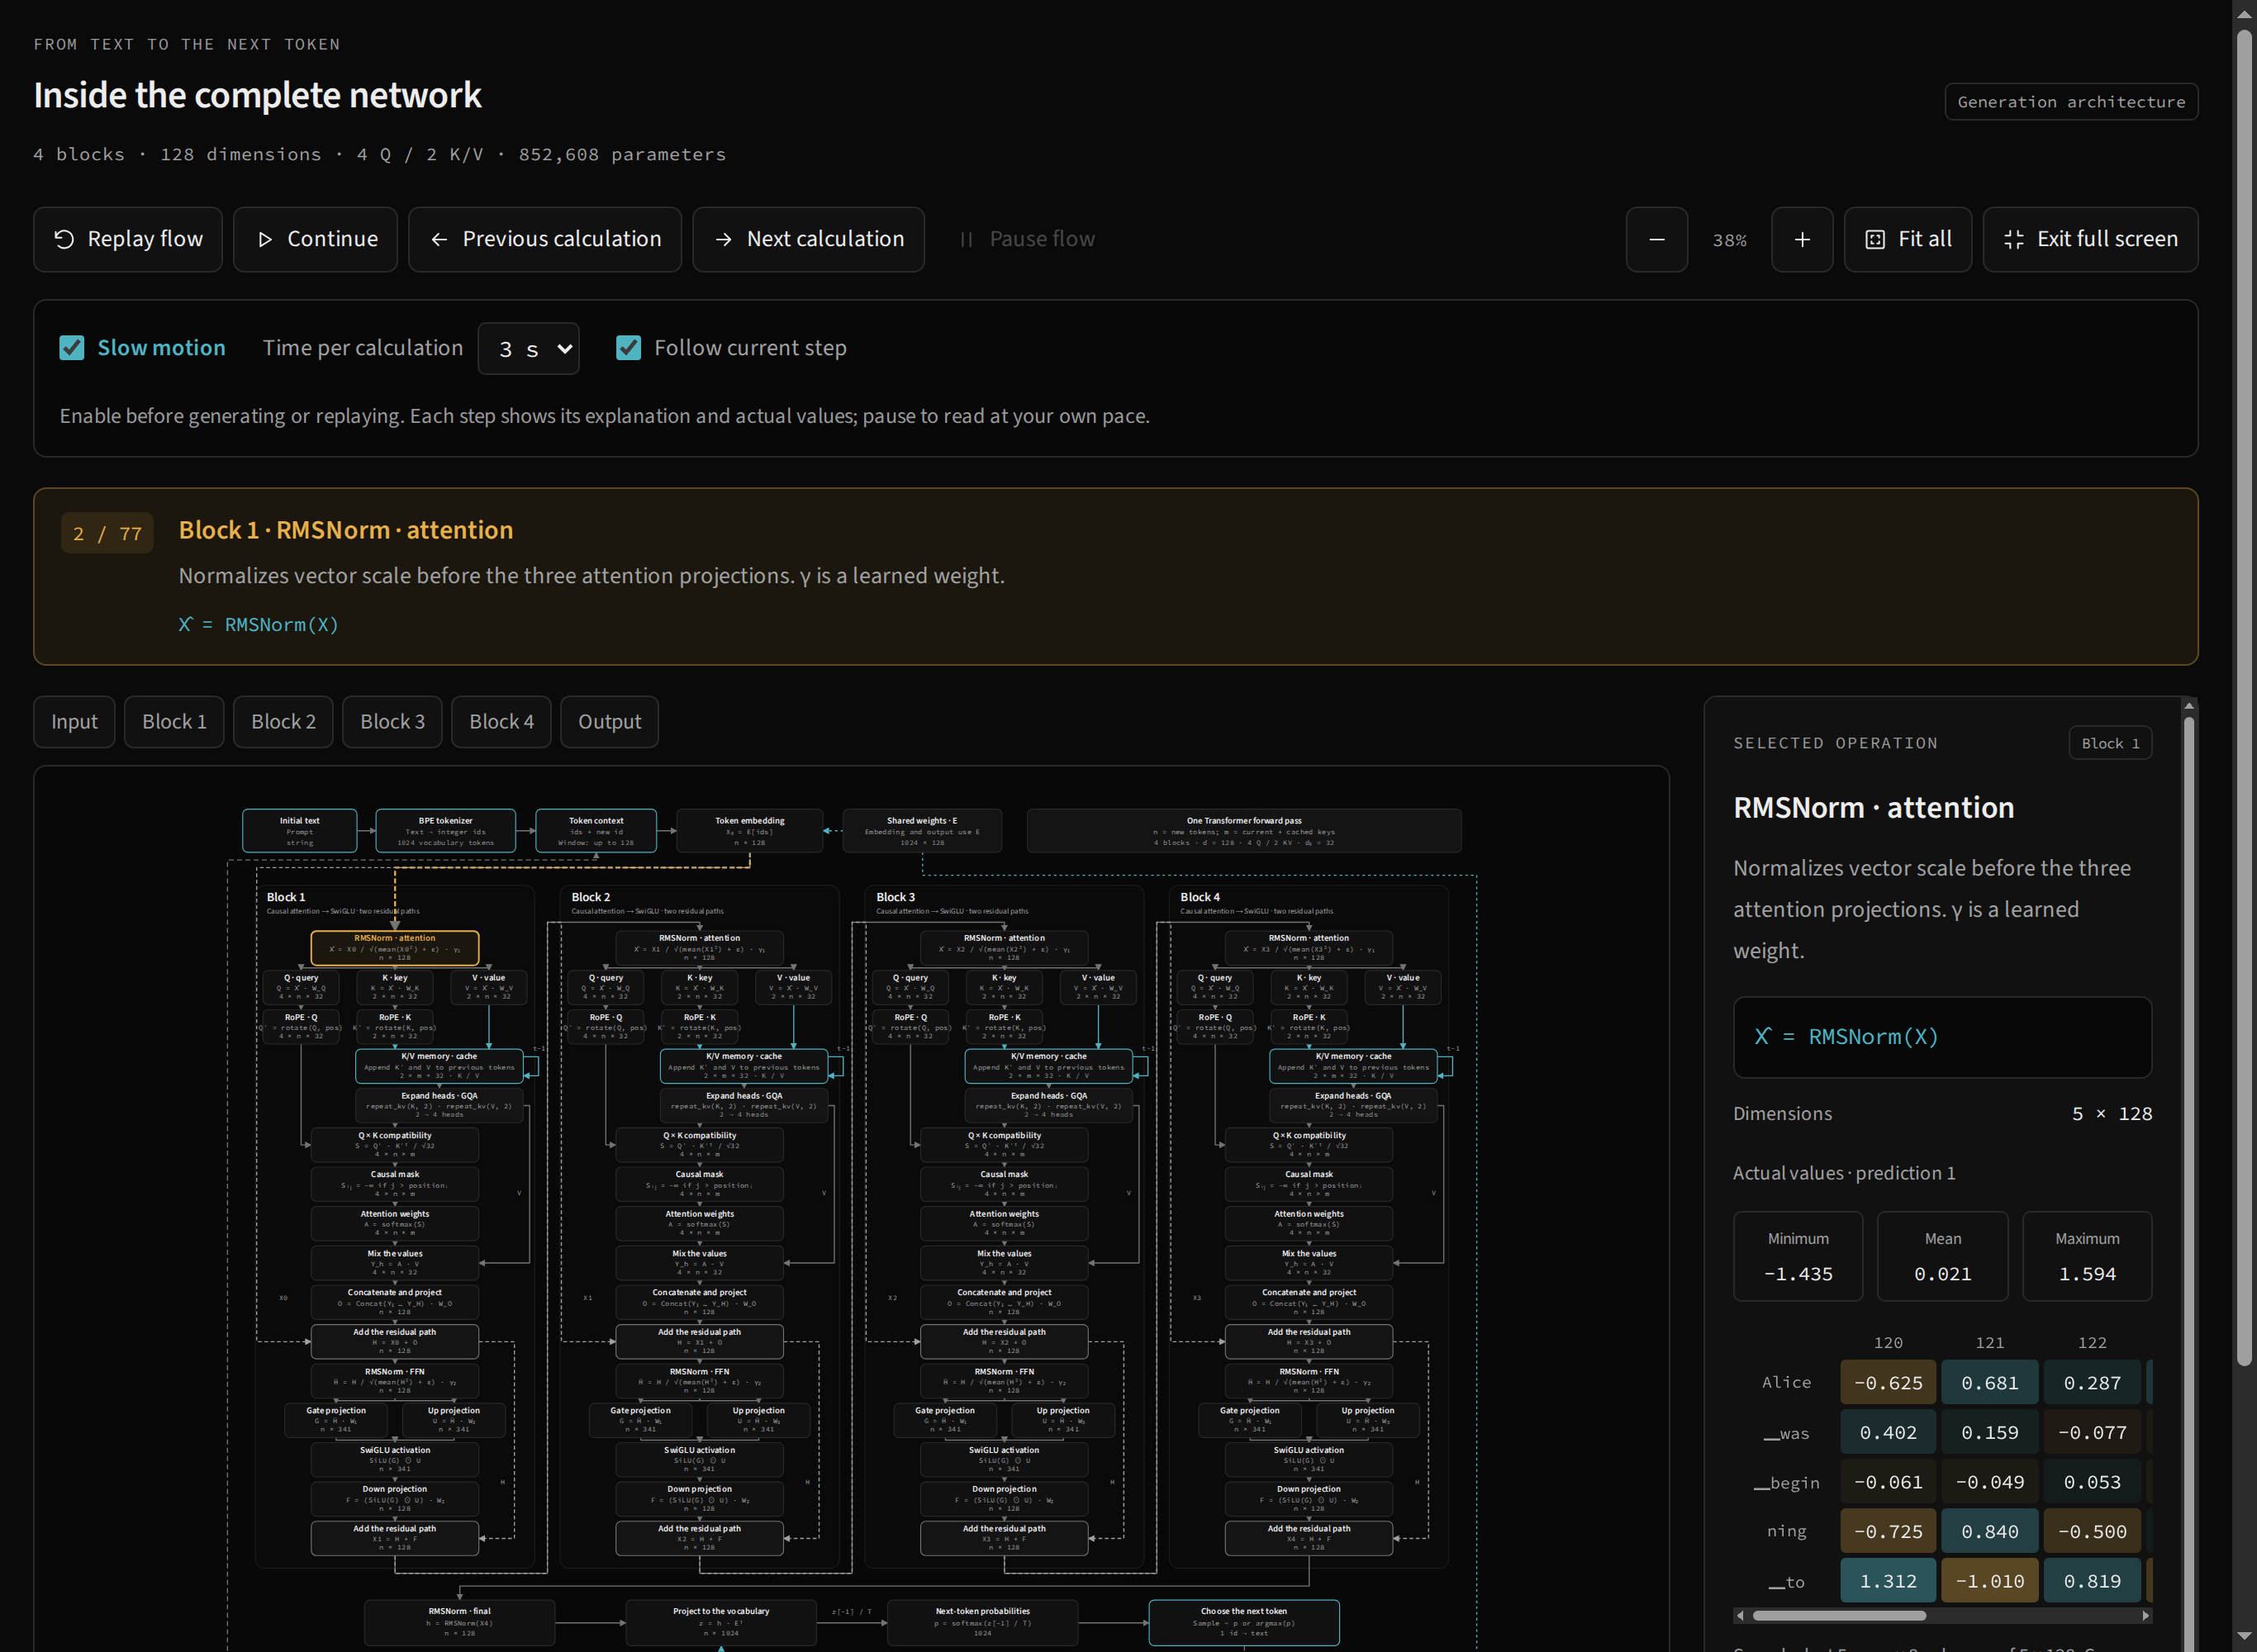
Explore the network takes you to the prediction map. It contains text input, tokenization, context, embedding, four Transformer blocks, final RMSNorm, logits, probabilities, selection and the ID’s return to context. The default topology has 90 nodes and 118 connections; 77 steps correspond to recorded events in generation.
Use Fit all to recognize regions, then Input, Block 1–4 or Output to zoom into a region. The diagram describes generation by a causal decoder; loss and backward calculations used in training are not part of this prediction path.
Read one block
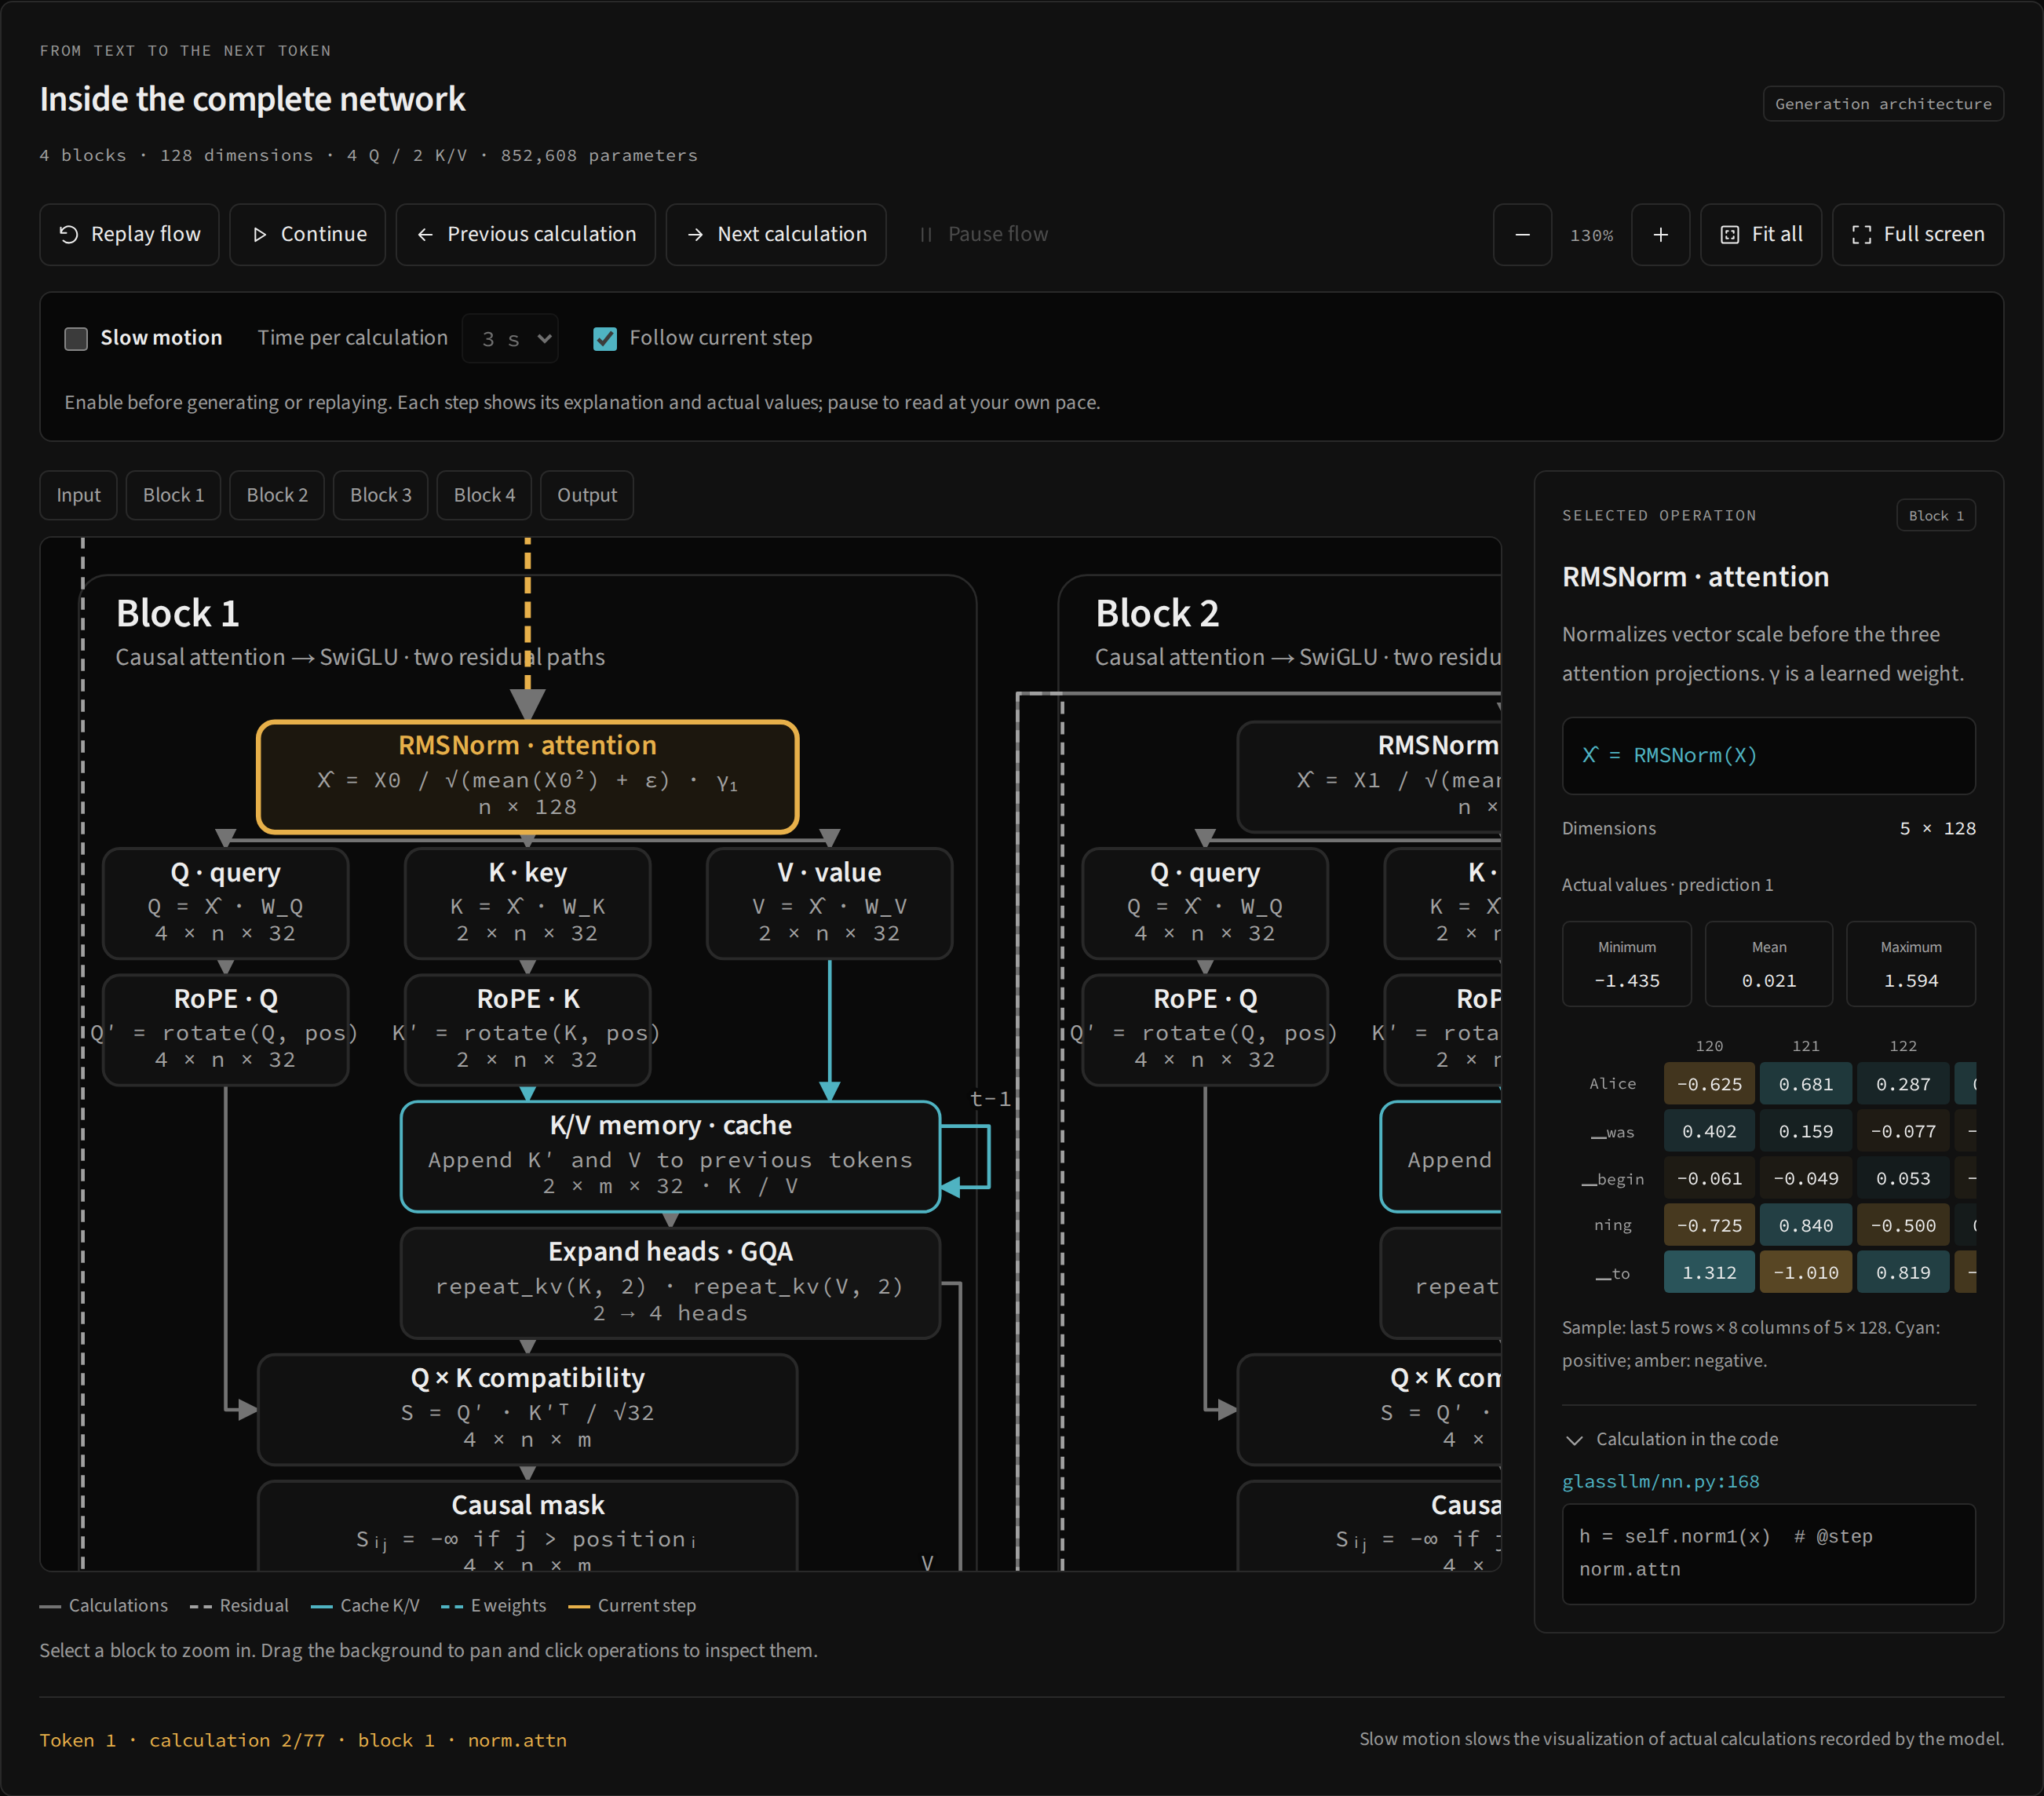
Each block has two sections, with normalization before each transformation:
- Input passes through RMSNorm and branches into Q, K and V projections.
- Q and K receive RoPE. K after RoPE and V feed the block’s cache.
- GQA makes the two K/V heads available to the four Q heads.
QKᵀ / √dₖproduces scores; the mask blocks the future; softmax turns scores into weights.- Weights mix V; heads are joined and projected with
W_O. - The first residual addition adds the original input to the attention output.
- Another RMSNorm feeds the FFN’s gate and up branches.
- SwiGLU computes
SiLU(gate) ⊙ up; down returns to 128 dimensions. - The second residual addition preserves the FFN input and sends the result to the next block.
Branches explain that Q, K and V come from the same normalized input, and that residuals carry information around transformations. Playback follows the order recorded by the code; it does not represent parallel execution of branches.
Recognize special connections
| Legend | Relationship shown |
|---|---|
| Calculations | Dependencies in one prediction’s path |
| Residual | Addition of an earlier state to a subsequent transformation |
| Cache K/V | Reuse of rotated keys and values from earlier positions |
| E weights | The same matrix in input and logit projection |
| Current step | Operation highlighted during playback or selection |
Matrix E has shape 1024 × 128. Input uses E[ids]; output uses h @ Eᵀ. The cache is separate for each block. GQA shares K/V weights between queries; repeating heads for attention products does not create new learned matrices.
Dimensions change during generation
The diagram uses n for positions computed in the current advancement and m for positions available in the keys. For the first predicted token, the model computes the full prefix and usually n = m. With cache, n = 1 and m grows with the context.
One Q head has shape n × 32; one score or weight head has shape n × m. When the 128-token window fills, the engine rebuilds the cache for the latest window. Seeing multiple rows again does not mean the visualization lost the cache: a legitimate rebuild may be taking place.
Zoom, pan and selection
Use + / − to change scale, Fit all to fit the graph, and block tabs to locate regions. On desktop, drag the background with the mouse; on mobile, scroll the map. Full screen expands available space when the browser permits it; Esc exits that mode.
Click an operation to open its values. Selection pauses continuous generation and visual playback. Nodes can also receive focus and be activated with Enter or Space. Follow current step moves the viewport during slow motion; turn it off to study a fixed region.
Cache, GQA, context and shared weights are structural nodes with no independent snapshot. The inspector describes their role and symbolic dimensions; it does not invent a matrix for them. See the inspector for value limitations and slow motion to walk through each event.